To install
sudo apt-get install htopTo run
htop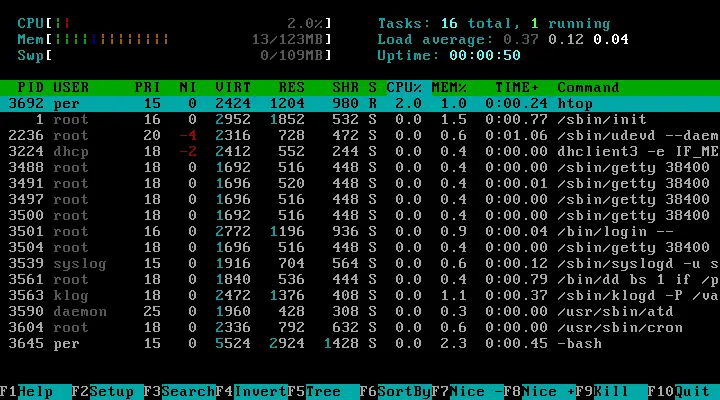
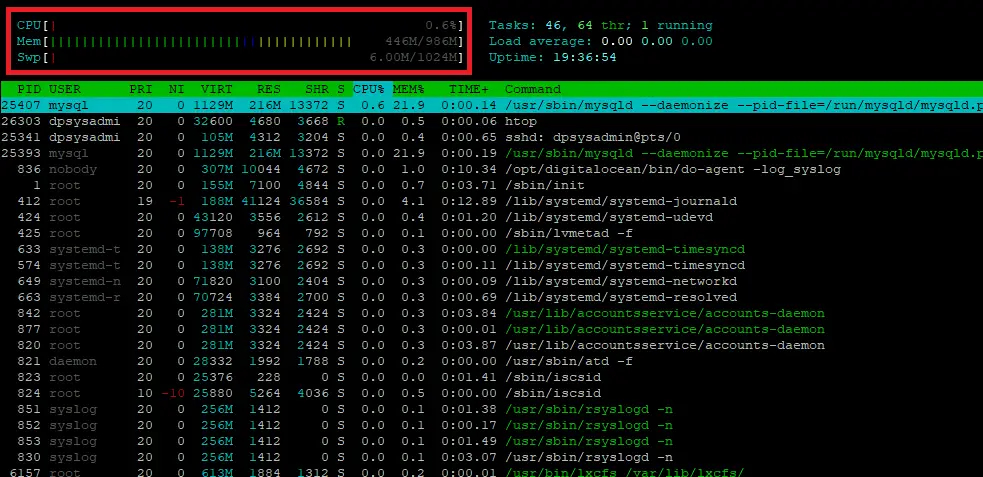
htop shows a frequently updated list of the processes currently running, normally ordered by the amount of CPU usage. Unlike top, htop provides a full list of processes running, instead of the top resource-consuming processes. Htop uses color and gives visual information about processor, swap and memory status.
Users often deploy htop in cases where Unix top does not provide enough information about the system’s processes. htop is also popularly used interactively as a system monitor. Compared to top, it provides a more convenient, visual, cursor-controlled interface for sending signals to processes.
htop is written in the C programming language using the ncurses library. Its name is derived from the original author’s first name, as a nod to pinfo, an info-replacement program that does the same.
htop Usage
Command-line Options
-d --delay=DELAY- Delay between updates, in tenths of seconds
-C --no-color --no-colour- Start htop in monochrome mode
-h --help- Display a help message and exit
-u --user=USERNAME- Show only the processes of a given user
-p- Start working thread for pagemap memory stats
-s --sort-key COLUMN- Sort by this column (use –sort-key help for a column list)
-v --version- Output version information and exit
Interactive Commands
- Arrows,
PgUP,PgDn,Home,End - Scroll the process list.
Space- Tag or untag a process. Commands that can operate on multiple processes, like “kill”, will then apply over the list of tagged processes, instead of the currently highlighted one.
U- Untag all processes (remove all tags added with the Space key).sTrace process system calls: if strace(1) is installed, pressing this key will attach it to the currently selected process, presenting a live update of system calls issued by the process.lDisplay open files for a process: if lsof(1) is installed, pressing this key will display the list of file descriptors opened by the process.
F1,h,- Go to the help screen
F2,S- Go to the setup screen, where you can configure the meters displayed at the top of the screen, set various display options, choose among color schemes, and select which columns are displayed, in which order.
F3,/- Incrementally search the command lines of all the displayed processes. The currently selected (highlighted) command will update as you type. While in search mode, pressing F3 will cycle through matching occurrences.
F4,\- Incremental process filtering: type in part of a process command line and only processes whose names match will be shown. To cancel filtering, enter the Filter option again and press Esc.
F5,t- Tree view: organize processes by parenthood, and layout the relations between them as a tree. Toggling the key will switch between tree and your previously selected sort view. Selecting a sort view will exit tree view.
F6,<,>- Select a field for sorting. The current sort field is indicated by a highlight in the header.
F7,]- Increase the selected process’s priority (subtract from ‘nice’ value). This can only be done by the superuser.
F8,[- Decrease the selected process’s priority (add to ‘nice’ value)
F9,k- “Kill” process: sends a signal which is selected in a menu, to one or a group of processes. If processes were tagged, sends the signal to all tagged processes. If none is tagged, sends to the currently selected process.
F10,q- Quit
I- Invert the sort order: if sort order is increasing, switch to decreasing, and vice-versa.+, –When in tree view mode, expand or collapse subtree. When a subtree is collapsed a “+” sign shows to the left of the process name.
a(on multiprocessor machines)- Set CPU affinity: mark which CPUs a process is allowed to use.
u- Show only processes owned by a specified user.MSort by memory usage (top compatibility key).PSort by processor usage (top compatibility key).
TSort by time (top compatibility key). F- “Follow” process: if the sort order causes the currently selected process to move in the list, make the selection bar follow it. This is useful for monitoring a process: this way, you can keep a process always visible on screen. When a movement key is used, “follow” loses effect.
K- Hide kernel threads: prevent the threads belonging the kernel to be displayed in the process list. (This is a toggle key.)
H- Hide user threads: on systems that represent them differently than ordinary processes (such as recent NPTL-based systems), this can hide threads from userspace processes in the process list. (This is a toggle key.)
Ctrl+L- Refresh: redraw screen and recalculate values.
- Numbers
- PID search: type in process ID and the selection highlight will be moved to it.
Columns
The following columns can display data about each process. A value of ‘-‘ in all the rows indicates that a column is unsupported on your system, or currently unimplemented in htop. The names below are the ones used in the “Available Columns” section of the setup screen. If a different name is shown in htop’s main screen, it is shown below in parenthesis.
- Command
- The full command line of the process (i.e program name and arguments).
- PID
- The process ID.
- PPID
- The parent process ID.
- PGRP
- The process’s group ID.
- SESSION (SESN)
- The process’s session ID.
- TTY_NR (TTY)
- The controlling terminal of the process.
- TPGID
- The process ID of the foreground process group of the controlling terminal.
- STATE (S)
- The state of the process: S for sleeping (idle) R for running D for disk sleep (uninterruptible) Z for zombie (waiting for parent to read it’s exit status) T for traced or suspended (e.g by SIGTSTP) W for paging
- PROCESSOR (CPU)
- The ID of the CPU the process last executed on.
- NLWP
- The number of threads in the process.
- NICE (NI)
- The nice value of a process, from 19 (low priority) to -20 (high priority). A high value means the process is being nice, letting others have a higher relative priority. Only root can lower the value.
- PERCENT_CPU (CPU%)
- The percentage of the CPU time that the process is currently using.
- UTIME (UTIME+)
- The user CPU time, which is the amount of time the process has spent executing on the CPU in user mode (i.e everything but system calls), measured in clock ticks.
- STIME (STIME+)
- The system CPU time, which is the amount of time the kernel has spent executing system calls on behalf of the process, measured in clock ticks.
- TIME (TIME+)
- The time, measured in clock ticks that the process has spent in user and system time (see UTIME, STIME above).
- CUTIME
- The children’s user CPU time, which is the amount of time the process’s waited-for children have spent executing in user mode (see UTIME above).
- CSTIME
- The children’s system CPU time, which is the amount of time the kernel has spent executing system calls on behalf of all the process’s waited-for children (see STIME above).
- PRIORITY (PRI)
- The kernels internal priority for the process, usually just it’s nice value plus twenty. Different for real-time processes.
- PERCENT_MEM
- The percentage of memory the process is currently using (based on the process’s resident memory size, see M_RESIDENT below).
- M_SIZE (VIRT)
- Size in memory of the total program size.
- M_RESIDENT (RES)
- The resident set size, i.e the size of the text and data sections, plus stack usage.
- M_SHARE (SHR)
- The size of the process’s shared pages
- M_TRS (CODE)
- The size of the text segment of the process (i.e the size of the processes executable instructions).
- M_LRS (LIB)
- The library size of the process.
- M_DRS (DATA)
- The size of the data segment plus stack usage of the process.
- M_DT (DIRTY)
- The size of the dirty pages of the process.
- ST_UID (UID)
- The user ID of the process owner.
- USER
- The username of the process owner, or the user ID if the name can’t be determined.
- STARTTIME
- The time the process was started.
- RCHAR (RD_CHAR)
- The number of bytes the process has read.
- WCHAR (WR_CHAR)
- The number of bytes the process has written.
- SYSCR (RD_SYSC)
- The number of read(2) syscalls for the process.
- SYSCW (WR_SYSC)
- The number of write(2) syscalls for the process.
- RBYTES (IO_RBYTES)
- Bytes of read(2) I/O for the process.
- WBYTES (IO_WBYTES)
- Bytes of write(2) I/O for the process.
- IO_READ_RATE (IORR)
- The I/O rate of read(2) in bytes per second, for the process.
- IO_WRITE_RATE (IOWR)
- The I/O rate of write(2) in bytes per second, for the process.
- IO_RATE (IO)
- The I/O rate, IO_READ_RATE + IO_WRITE_RATE (see above).
- CNCLWB (IO_CANCEL)
- Bytes of cancelled write(2) I/O.
- CGROUP
- Which cgroup the process is in.
- CTID
- OpenVZ container ID, a.k.a virtual environment
- ID.VPID
- OpenVZ process ID.
- VXID
- VServer process ID.
Let me know if this helped. Follow me on Twitter, Facebook and YouTube, or 🍊 buy me a smoothie.
Nice content. Since i entered the page i got my responde, i wanted to know what command i needed to do to monitor my cpu and the “top” apeared. Thanks!